Survey Completion Rate Timeline After Publishing
A survey completion rate timeline should be checked immediately after launch, again after the first 24 hours, after each reminder, and at close when responses plateau. The goal is to see whether people are starting, abandoning, or completing the survey fast enough to justify waiting, fixing the survey, sending a follow-up, or ending collection.
> Definition: A survey completion rate timeline is the schedule for tracking completed surveys divided by started surveys over the full collection period, from launch to final analysis.
TL;DR
- Check starts and early drop-offs in the first few hours, because most survey friction appears quickly.
- Use days 1–3 to judge the response curve, then send a reminder if starts or completions stall.
- For many customer, event, classroom, and nonprofit surveys, a 7–14 day field period is enough once completions plateau.
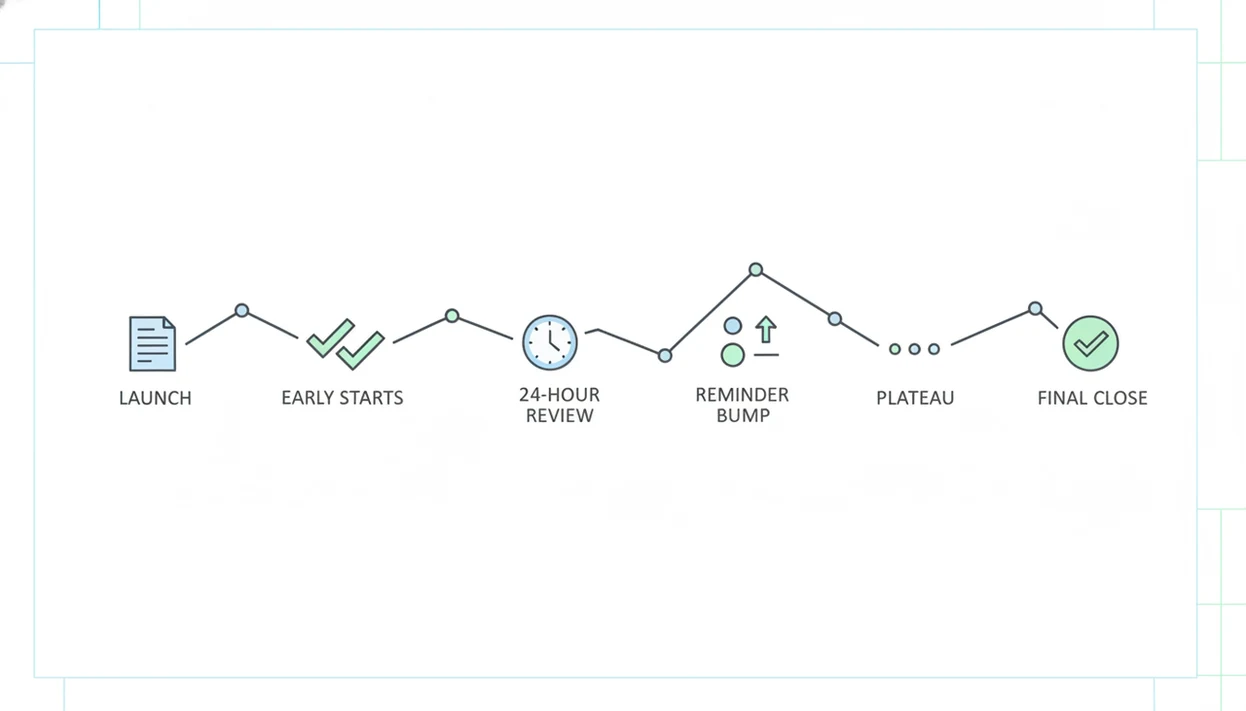
Survey completion rate timeline at a glance
Use this timeline to spot problems while the survey is still fixable, not after everyone has moved on. Completion rate tracks finishers among people who started; response rate tracks returns among everyone invited.
| Timeline point | What to check | What it tells you |
|---|---|---|
| Launch hour | Link, opens, starts | Delivery or access problems |
| First few hours | Starts, first-page drop-offs | Confusing intro, bad mobile layout, wrong audience |
| 24 hours | Completions, abandonment | Whether the first response wave is healthy |
| Day 3 | Trend line, channel gaps | Whether reminders are needed |
| After reminder | Reminder bump | Whether follow-up worked |
| Final close | Plateau, data quality | Whether collection should stop |
For many practical online surveys, 7–14 days is enough once completions flatten. A newsletter poll may close faster; a parent survey may need a weekend. Frame 7–14 days as an operating range, not a universal benchmark: high-stakes research, hard-to-reach audiences, or required sample quotas may need a longer field period.
Tiny screens expose weak questions fast.
Survey completion rate tracking formula
Survey completion rate is calculated as completed surveys divided by started surveys, multiplied by 100. Response rate is different: it usually means completed or returned surveys divided by the total number of invited people.
The mechanism is simple, but the timeline adds meaning. Most surveys show an early spike after launch, a slower middle period, and a plateau after one reminder. If 100 people start and 72 submit, the completion rate is 72%. If 500 people were invited and 72 submit, the response rate is 14.4%.
How survey completion rate timeline works: it converts scattered starts and submissions into a response curve, which is a time-based view of survey behavior. In plain language, it shows when people act, where they quit, and when waiting stops adding much value.
AAPOR-style survey reporting also has nuance: under AAPOR Standard Definitions, a ‘complete’ interview can depend on how much of the applicable questionnaire was answered, not whether every optional item was completed source.
How survey completion rate timelines work
Survey completion rate timelines work by turning each start, submit, and quit into a time-based pattern. A start means someone opened or began the survey, a complete means they submitted enough to count, and an abandon means they started but did not finish; response rate measures returns among everyone invited, while completion rate measures finishers among starters.
Timestamps make the pattern visible because every action is attached to a moment. The workflow is usually:
- Record when each person starts the survey, submits it, or drops out before submitting.
- Group those actions by hour or day so the scattered events become a response curve.
- Compare the curve after launch, after reminders, and near the close date.
- Decide whether to fix wording, send a nudge, extend collection, or stop waiting.
Launch spikes show the first wave of attention. Reminder bumps show whether follow-up still reaches people. Plateaus show when extra days may add little. This timeline helps operations, but it cannot prove the answers represent the whole audience.
3-checkpoint survey follow-up schedule after launch
Follow this survey follow up schedule when you need a practical monitoring rhythm without turning the survey into a research project.
- Set your baseline before launch. Use past surveys, audience size, channel, and expected deadline pressure to estimate starts and completions.
- Check the first few hours. Look for broken links, low starts, and first-page abandonment caused by unclear wording.
- Review day one and day three. Compare starts, completions, and abandoned surveys to see whether the response curve is slowing normally.
- Send one reminder when activity flattens. Time it after the first spike, not five minutes after launch.
- Close or extend based on the plateau. Use sample needs, data quality, and remaining audience gaps, not habit.
For small teams, one reminder after the initial slowdown is often easier to manage than repeated nudges because it protects attention and keeps the timeline readable.
How to use a survey completion rate timeline
Use a survey completion rate timeline as a live control panel for collection, not as a report you read after the survey is over. It helps you decide when to wait, remind, repair, extend, or close.
- Start with the basics before launch: invited count, minimum completes, close date, and the audience segments you must hear from. This gives every later number a reference point.
- Check access on launch day by opening the link yourself, then watching starts and first-page drop-off. If people arrive but quit immediately, the intro, device layout, or eligibility wording may be blocking them.
- Compare day-one and day-three completions against the response curve you expected from the channel and deadline. A quick customer poll and a school parent survey should not be judged by the same pace.
- Send one reminder only after the first activity spike slows. That keeps the nudge meaningful and makes the reminder bump easier to read.
- Close the survey, extend the window, or edit a weak question based on the plateau and any missing segments, not just the calendar.
Survey response timeline evaluation method
A useful survey response timeline is measured in three stages: before launch, during collection, and after close. The point is to turn answers into next steps while the form is still live.
- Before launch: Record invited count, audience segments, channel, expected close date, and the minimum useful number of completes.
- During collection: Log invited, opened, started, completed, abandoned, completion rate, and response rate each day.
- By channel: Segment email, SMS, QR code, website embed, and in-app links because each audience behaves differently.
- After reminders: Compare the bump in starts and completions against the previous day, not against a vague benchmark.
- After close: Review drop-off points before copying the next survey template.
A simple daily log works. A dashboard works too. Apps such as Forms AI can help non-technical teams watch starts and completions without waiting for a spreadsheet export.
Customer feedback survey completion rate timeline example
A small business customer survey usually gets its strongest activity in the first few days. Picture a shop owner checking a phone screen behind the counter after sending a five-question satisfaction survey to recent buyers.
Day one brings the first wave. By day three, starts slow and completions flatten. The owner sends one reminder with a shorter subject line and keeps the required fields few: rating, reason, preferred contact method, and one optional comment. If two more days add only a handful of completes, closing makes sense.
Tools like Forms AI fit this app-first moment because the owner can create the survey, preview it, and track the response list from a phone between customer calls. For structure, a customer feedback survey template is often safer than starting from a blank page.
More days are not always more insight.
Classroom survey response timeline after publishing
A classroom survey often has a shorter timeline because the school schedule creates its own deadline. A teacher might copy a quiz link into a class announcement five minutes before the bell, then check completions later that afternoon.
The 24-hour check shows whether students or parents could open the survey. The 48-hour check shows missing classes, grade levels, or parent groups. If one homeroom has almost no starts, the problem may be the channel, not the question wording.
Mobile-friendly layout matters here. Parent/guardian name, student class, and one plain-language question should fit without pinching the screen. If the survey is for feedback rather than a graded quiz, the teacher can send one reminder and close before the topic goes stale.
For survey length planning, the how many questions feedback survey guide explains why shorter forms are easier to finish.
Event registration survey follow-up schedule
An event survey timeline is tied to operational decisions, not just analysis. An organizer checking RSVP counts in a parking lot while a vendor texts about table numbers needs usable answers quickly.
Before the event, reminders should match the deadline for catering, seating, or volunteer shift planning. After the event, the follow-up window is shorter because memory fades. A post-event survey after stacked chairs may get useful responses in the first 48 hours, then slow sharply.
Watch abandonment on long preference questions. If many people quit at “rank all session topics,” change it to “pick your top two.” That edit can save the survey while it is still live. An AI Form Builder used for event registration should let organizers build, preview, share, and adjust RSVP forms quickly, without burying them in enterprise survey administration.
Event teams comparing tools may also need a best event registration form app workflow.
4 common survey completion rate timeline patterns
Most survey timelines follow four visible patterns. Name the pattern first, then decide what to do.
- Early spike: Launch day often brings the most starts because the message is fresh and easy to find.
- Middle drop-off: Length, complex grids, unclear wording, and poor mobile design cause starters to quit.
- Reminder bump: A scheduled follow-up can lift response activity; a U.S. Bureau of Labor Statistics experiment found one reminder raised overall response rate by about 10 percentage points source.
- Final plateau: Additional days add little value when starts and completions stay flat.
Shorter surveys usually finish better. A Field Methods randomized experiment found that shortening a web survey from 30 minutes to 10 minutes increased completion rates from 53% to 77% source. For customer surveys, fewer focused questions are often better than a long “while we have you” form.
Completion rate tracking data gaps
Completion rate tracking tells you whether starters finish, but it does not prove the data represents the whole audience. A clean curve can still hide bias, missing groups, or shallow answers.
| Data signal | What it can show | What it cannot prove |
|---|---|---|
| High completion rate | Starters are finishing | Results are representative |
| High response count | Many people submitted | Few people abandoned |
| Long field period | More time was available | Better data quality |
| Late responses | Reminders reached some people | Late respondents match early ones |
| Past benchmark | Similar survey comparison | Universal success standard |
Compare against your own similar surveys whenever possible. Pew Research Center reported that its national telephone surveys had a median response rate of 6% in 2023, down from 36% in 1997 source. That decline is a reminder: willingness to participate changes by audience, mode, and era.
The survey vs form distinction also matters when you are judging depth versus simple collection.
Limitations
A survey completion timeline is useful, but it can be easy to overread. Treat it as an operating signal, not a truth machine.
- External events, seasonality, holidays, weather, and major news can distort response speed.
- Email deliverability and spam filtering can make a strong survey look weak.
- Small sample sizes make percentages swing dramatically after only a few submissions.
- Incentives may increase participation, but they can change who responds and why.
- Longer collection periods do not always improve data quality after the curve plateaus.
- Completion rate does not measure whether answers are truthful, thoughtful, or representative.
- Channel mix matters; QR code scans at an event behave differently from email invitations.
- Optional questions can create hidden gaps even when the final submit count looks healthy.
If the stakes are high, pair completion rate tracking with sampling review, segment checks, and answer-quality review before making decisions.
FAQ
How soon should I check survey completions after publishing?
Check the link and starts immediately, review early drop-offs within the first few hours, then check again at 24 hours, after reminders, and at close.
How do I calculate survey completion rate?
Survey completion rate equals completed surveys divided by started surveys, multiplied by 100. If 80 people start and 60 submit, the completion rate is 75%.
What is the difference between completion rate and response rate?
Completion rate measures finishers among people who started the survey. Response rate measures completed or returned surveys among everyone invited.
When should I send a survey reminder?
Send a reminder after the initial response spike slows or stalls. For many short online surveys, that often means around day two or day three.
How long should I keep a survey open?
Keep the survey open until completions plateau or your sample needs are met. Many practical customer, event, classroom, and nonprofit surveys close within 7–14 days.
Why do people start a survey but not finish it?
Common reasons include too many questions, confusing wording, poor mobile layout, sensitive questions, and low motivation. Drop-off location usually points to the likely cause.
Do shorter surveys get higher completion rates?
Yes, shorter surveys generally have higher completion rates than longer surveys. Evidence from web survey research shows large gains when survey length is reduced.
Is completion rate enough to judge survey success?
No. Completion rate should be reviewed with response rate, audience representativeness, channel mix, and answer quality.